In the ever-evolving landscape of digital marketing and web analytics, understanding how users interact with your content is crucial. One key metric that provides valuable insights into user behavior is “average engagement time per active user.” This metric helps you gauge how long users are actively engaging with your content, giving you a clear picture of their interest and interaction levels.
Brief Explanation of Average Engagement Time Per Active User
Average engagement time per active user is a measure of how much time, on average, each user spends actively interacting with your website or application during a specified period. Unlike simple session duration, which might include time when users are inactive or idle, average engagement time focuses on the period when users are actively involved with the content. This includes activities such as reading articles, watching videos, or interacting with interactive elements.
To calculate this metric, you take the total engagement time (the sum of all time users spend actively engaging with your content) and divide it by the number of active users during that period. This provides a more nuanced understanding of how engaging your content is and how effectively it retains users’ attention.
Start your online success story now. Click to begin
Try Wealthy Affiliate (For Free).
Importance of Measuring Engagement Time
Measuring average engagement time is essential for several reasons:
- Indicator of Content Relevance: Higher engagement times generally indicate that users find your content relevant and interesting. If users spend more time actively interacting with your content, it suggests that it resonates with their interests and needs.
- User Experience Insight: This metric provides insights into the overall user experience. Longer engagement times can signal that your website or app offers a compelling and user-friendly experience, while shorter times might indicate issues with content quality or user interface design.
- Impact on Conversion Rates: Engagement time is often linked to conversion rates. Users who spend more time engaging with your content are more likely to convert, whether that means making a purchase, signing up for a newsletter, or taking any other desired action.
- Benchmark for Improvement: Tracking engagement time over time allows you to benchmark your performance and measure the impact of changes or improvements. By understanding how various factors influence engagement, you can make informed decisions to enhance user interaction.
Overview of the Article
In this article, we will explore the concept of average engagement time per active user in detail. We will start by defining the metric and explaining how it differs from other engagement measures. Next, we will delve into why this metric is important for assessing user interest and content effectiveness. We will also provide practical guidance on how to calculate average engagement time, including tools and platforms that can assist in tracking it. Furthermore, we will discuss the factors that influence engagement time and offer strategies to improve it. Finally, we will highlight the tools and resources available for tracking and analyzing this metric, helping you optimize your content and user experience.
What Is Average Engagement Time Per Active User?
Understanding user engagement is crucial for optimizing your digital presence and enhancing the user experience. One of the key metrics used to gauge how users interact with your content is “average engagement time per active user.” Let’s break down what this metric is, how it differs from other engagement metrics, and why it’s important.
Definition of Average Engagement Time
Average engagement time per active user is a metric that measures the average amount of time each user spends actively interacting with your content during a specific time frame. This interaction can include activities such as reading articles, watching videos, or clicking through interactive elements on a website or application. The metric focuses on the periods when users are actively engaged rather than when they are passive or idle.
To calculate this metric, you first determine the total engagement time, which is the sum of all periods when users are actively engaging with your content. Then, you divide this total by the number of active users during the same period. The result is the average amount of time each user spends actively engaging with your content.
How It Differs from Other Engagement Metrics
While average engagement time per active user is a valuable metric, it is distinct from other commonly used engagement metrics, such as session duration:
- Session Duration: This metric measures the total length of a user’s session on a website or app, including both active and idle times. It gives an overall picture of how long users stay on your site but does not differentiate between periods of active and passive engagement.
- Average Time on Page: This measures the average time users spend on a specific page. It can provide insights into how engaging individual pages are but does not account for the total time users spend across multiple pages or interactions.
- Bounce Rate: This metric indicates the percentage of users who leave your site after viewing only one page. While it provides information about user retention, it does not measure engagement depth.
- Engagement Rate: This is a broader metric that can encompass various forms of user interaction, such as clicks, shares, and comments. It provides an overview of user activity but doesn’t specifically measure the time spent actively engaging.
Average engagement time per active user focuses specifically on how long users are actively involved with your content, offering a more nuanced understanding of user interest and interaction quality.
Importance of This Metric in Understanding User Behavior
Average engagement time per active user is crucial for several reasons:
- Insight into Content Effectiveness: This metric helps you gauge how engaging and valuable your content is to users. Longer engagement times suggest that users find your content compelling and worth spending time on, which can indicate that it meets their needs and expectations.
- User Experience Evaluation: By tracking this metric, you can assess the overall user experience on your site or app. A higher average engagement time typically signifies a positive user experience, with users finding your interface and content appealing and easy to interact with.
- Identification of Improvement Areas: If average engagement time is lower than expected, it can highlight areas where improvements are needed. Whether it’s enhancing content quality, optimizing design, or addressing usability issues, understanding engagement time can guide targeted improvements.
- Correlation with Business Outcomes: Engaged users are more likely to convert, whether that means making a purchase, signing up for a service, or taking any other desired action. By focusing on improving engagement time, you can indirectly boost conversion rates and achieve better business results.
Why Average Engagement Time Matters
Average engagement time per active user is more than just a number; it’s a crucial indicator of how well your content and user experience resonate with your audience. Understanding why this metric matters can help you make informed decisions to enhance your digital strategy. Here’s why average engagement time is important:
Disclosure: This post includes affiliate links. If you make a purchase through these links, I may earn a commission. These links offer valuable resources to help you build a successful online business.
Try Wealthy Affiliate (For Free).
Indicator of User Interest and Content Relevance
- Gauge of Content Appeal: A high average engagement time suggests that users find your content interesting and valuable. When users spend more time actively engaging with your content, it often means that they are genuinely interested in what you have to say. This can be a sign that your content is meeting their needs, answering their questions, or providing entertainment.
- Feedback on Content Quality: Engagement time can serve as a direct feedback loop for content creators. If users are spending more time on certain types of content or topics, it indicates what they find most appealing. Conversely, low engagement times can signal that your content may need to be revised or improved to better capture and maintain user interest.
- Content Relevance: High engagement times can also reflect that your content is relevant to your audience. For example, if users are spending significant time on articles or videos that address their specific interests or problems, it suggests that your content is well-targeted and aligned with their needs.
Impact on Overall User Experience
- Enhanced User Experience: Average engagement time is a key metric in assessing the overall user experience on your website or app. A longer engagement time generally indicates that users are having a positive experience, enjoying the content, and finding the interface easy to use. This can be a result of factors such as intuitive navigation, visually appealing design, and high-quality content.
- User Interaction: When users engage deeply with your content, it often means that they are interacting with various elements of your site or app, such as links, multimedia, or interactive features. This level of interaction typically correlates with a well-designed user experience that keeps users interested and involved.
- Usability Insights: If average engagement time is low, it may indicate usability issues that need addressing. Users might be struggling to navigate your site, find relevant information, or interact with your content effectively. Identifying and addressing these issues can lead to improvements in engagement time and overall user satisfaction.
Correlation with Conversion Rates and Retention
- Conversion Rates: Engagement time is closely linked to conversion rates. Users who spend more time actively engaging with your content are more likely to complete desired actions, such as making a purchase, signing up for a newsletter, or filling out a contact form. Engaged users are more invested in what you have to offer, making them more likely to convert.
- User Retention: High average engagement time can also contribute to better user retention. When users are consistently engaged with your content, they are more likely to return to your site or app in the future. This ongoing interaction fosters a sense of loyalty and helps build long-term relationships with your audience.
- Customer Lifetime Value: Engaged users are often more valuable in the long run. They tend to have higher lifetime value because they are more likely to become repeat customers or advocates for your brand. By improving engagement time, you can enhance customer satisfaction and increase the likelihood of repeat business.
How to Calculate Average Engagement Time Per Active User
Calculating average engagement time per active user is a straightforward process, but it requires accurate data collection and analysis. Understanding how to perform this calculation and the tools available to help you track engagement time can greatly enhance your ability to measure and improve user interaction. Here’s a detailed guide on how to calculate this metric:
Formula for Calculation
To determine the average engagement time per active user, follow these steps:
- Gather Total Engagement Time:
- Definition: Total engagement time is the cumulative amount of time all users spend actively engaging with your content during a specific period. This can include activities like reading articles, watching videos, or interacting with features on your website or app.
- Data Collection: Collect data on the total time users have spent engaging with your content. This data might be available through your web analytics or social media platforms.
- Count the Number of Active Users:
- Definition: Active users are those who have interacted with your content within the specified period. This number excludes users who may have visited your site but did not actively engage with it.
- Data Collection: Obtain the count of active users from your analytics tools. Ensure that this count aligns with the same period used to calculate total engagement time.
- Apply the Formula:
- Formula: Average Engagement Time per Active User=Total Engagement TimeNumber of Active Users\text{Average Engagement Time per Active User} = \frac{\text{Total Engagement Time}}{\text{Number of Active Users}}Average Engagement Time per Active User=Number of Active UsersTotal Engagement Time
- Example Calculation: If the total engagement time is 5,000 minutes and there are 1,000 active users, the average engagement time per active user would be: 5,000 minutes1,000 active users=5 minutes per user\frac{5,000 \text{ minutes}}{1,000 \text{ active users}} = 5 \text{ minutes per user}1,000 active users5,000 minutes=5 minutes per user
By using this formula, you can determine the average amount of time each user spends engaging with your content, providing valuable insights into user behavior and content effectiveness.
Tools and Platforms for Tracking Engagement Time
To accurately measure and analyze engagement time, various tools and platforms can help you gather and interpret the necessary data:
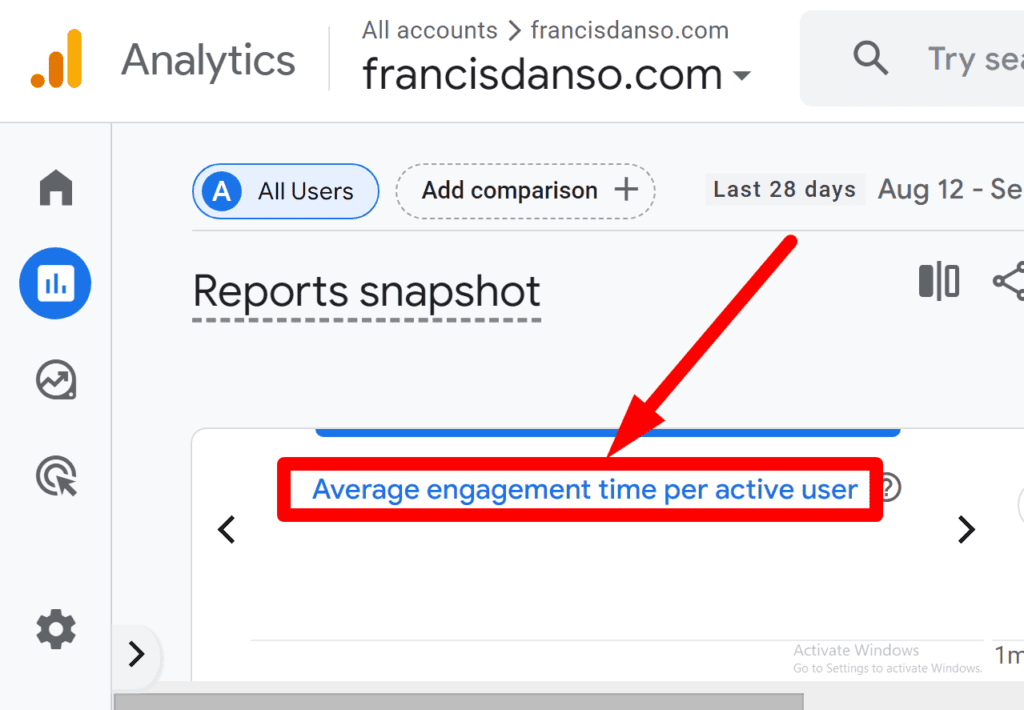
- Google Analytics:
- Overview: Google Analytics is a comprehensive web analytics tool that tracks various metrics related to user behavior on your website. It provides detailed reports on user engagement, including average session duration, page views, and user interactions.
- How to Use: In Google Analytics, you can track engagement time through metrics such as “Average Session Duration” and “Average Time on Page.” While it might not provide a direct measure of average engagement time per active user, these metrics can be used to infer user engagement patterns and calculate relevant statistics.
- Steps: Set up Google Analytics on your website, navigate to the “Behavior” section, and review the engagement metrics. You can also create custom reports to focus specifically on engagement time.
- Social Media Analytics Tools:
- Overview: Social media platforms like Facebook, Twitter, and Instagram offer built-in analytics tools that provide insights into user interactions and engagement on your social media content.
- Examples: Tools like Facebook Insights, Twitter Analytics, and Instagram Insights offer data on metrics such as post reach, engagement, and time spent on content.
- How to Use: Access the analytics section of your social media accounts to review engagement metrics. Track the total engagement time and the number of active users (followers or viewers) to calculate average engagement time per active user.
Ready to take control of your income? Start here!
Try Wealthy Affiliate (For Free).
Other Tools to Consider:
- Mixpanel: Provides advanced analytics and tracking of user interactions across web and mobile apps, offering detailed insights into engagement and retention.
- Hotjar: Offers heatmaps and session recordings to visualize user interactions and understand engagement patterns.
Factors Influencing Average Engagement Time
Understanding the factors that influence average engagement time per active user can help you identify areas for improvement and enhance user interaction with your content. Several key elements can impact how long users stay engaged, including content quality, user interface design, update frequency, and the devices or platforms used. Let’s delve into each of these factors:
Content Quality and Relevance
- Engaging Content: High-quality, engaging content is fundamental to keeping users interested and active. Content that is well-written, informative, and relevant to users’ interests tends to capture and retain attention better. Whether it’s articles, videos, infographics, or interactive features, the quality of your content plays a crucial role in engagement.
- Relevance to Audience: Tailoring content to meet the needs and preferences of your target audience can significantly impact engagement time. Conducting audience research to understand their interests, pain points, and preferences allows you to create content that resonates with them, encouraging longer and more meaningful interactions.
- Value Addition: Content that provides real value—such as practical advice, solutions to problems, or unique insights—encourages users to spend more time engaging with it. Value-driven content fosters deeper connections with your audience and increases the likelihood of prolonged engagement.
User Interface and User Experience (UI/UX)
- Intuitive Design: A user-friendly and intuitive interface enhances the overall user experience and encourages longer engagement. Navigation should be easy to understand, with clear menus, buttons, and links that guide users seamlessly through your content.
- Visual Appeal: An aesthetically pleasing design that uses appealing visuals, such as images, videos, and graphics, can capture users’ attention and keep them engaged. A visually cluttered or outdated design, on the other hand, can detract from the user experience and lead to shorter engagement times.
- Loading Speed: Fast-loading pages and content are crucial for maintaining user engagement. Slow load times can frustrate users and lead to higher bounce rates, reducing the average engagement time. Optimizing website performance and reducing load times can help keep users engaged.
- Mobile Responsiveness: With the increasing use of mobile devices, ensuring that your content is optimized for mobile is essential. A responsive design that works well on smartphones and tablets can improve engagement time, as users are more likely to stay engaged with content that is easy to access and navigate on their devices.
Frequency of Content Updates
- Regular Updates: Frequently updating your content keeps it fresh and relevant, which can encourage users to return and engage more often. Regular updates can include adding new blog posts, articles, videos, or interactive features that provide ongoing value to your audience.
- Timeliness: Keeping content timely and aligned with current trends or events can boost engagement. Users are more likely to engage with content that addresses current topics or emerging trends that are relevant to their interests.
- Content Variety: Offering a variety of content types and formats can keep users engaged by providing diverse experiences. For example, mixing written articles with videos, infographics, and interactive elements can cater to different user preferences and maintain their interest over time.
Device and Platform Used
- Device Preferences: Users’ engagement time can vary depending on the device they are using. For example, users might spend more time on desktop computers compared to mobile devices, where engagement might be shorter due to smaller screen sizes and on-the-go usage patterns.
- Platform-Specific Features: Different platforms offer unique features that can influence engagement time. For instance, a social media platform might have built-in interactive elements that increase engagement, while a website might offer more in-depth content. Understanding how users interact with your content on various platforms can help tailor your strategy to optimize engagement.
- Cross-Platform Consistency: Ensuring a consistent and seamless experience across different devices and platforms can enhance user engagement. Users who have a positive experience on one device or platform are more likely to return and engage further across other devices.
Strategies to Improve Average Engagement Time
Improving average engagement time per active user involves implementing effective strategies to enhance content quality, optimize user experience, and ensure relevance. By focusing on these key areas, you can create a more engaging and enjoyable experience for users, leading to longer interactions with your content. Here are some strategies to help you boost average engagement time:
Enhancing Content Quality
- Creating Engaging and Relevant Content: High-quality content is the cornerstone of user engagement. To create content that captivates your audience, focus on producing material that is both interesting and valuable. This means addressing topics that matter to your audience, providing actionable insights, and presenting information in a compelling manner. Use storytelling techniques, clear language, and a conversational tone to keep readers engaged.
- Utilizing Multimedia (Videos, Infographics): Incorporating multimedia elements, such as videos and infographics, can significantly enhance content engagement. Visuals can help convey complex information more effectively and keep users interested. Videos, for example, can offer a dynamic way to present information, while infographics can make data more accessible and visually appealing. Make sure your multimedia content is relevant to your topic and adds value to the user experience.
Optimizing UI/UX
- Improving Website Design: A well-designed website or app contributes to a positive user experience and encourages longer engagement. Ensure that your design is clean, organized, and aesthetically pleasing. Use intuitive navigation to help users find what they’re looking for easily. Incorporate clear calls-to-action (CTAs) and ensure that interactive elements are functional and user-friendly.
- Ensuring Mobile Responsiveness: With the growing use of mobile devices, it’s essential to have a responsive design that works seamlessly across different screen sizes. Mobile responsiveness ensures that your content looks and functions well on smartphones and tablets, providing a consistent user experience. Test your design on various devices to ensure that it adapts effectively.
Personalization and User Targeting
- Implementing Personalized Recommendations: Personalization can significantly enhance user engagement by delivering content that matches individual preferences. Use data and analytics to understand user behavior and preferences, then implement personalized recommendations based on this information. For example, you can suggest related articles, products, or services based on users’ past interactions.
- Tailoring Content to User Interests: Segment your audience based on their interests, demographics, or behavior and tailor your content to address their specific needs. By delivering content that resonates with different user segments, you can increase the likelihood of prolonged engagement. Personalized content helps users feel more connected to your brand and more likely to spend time interacting with your material.
Regularly Updating Content
- Keeping Content Fresh and Relevant: Regularly updating your content ensures that it remains current and valuable to users. Fresh content not only keeps users engaged but also encourages them to return for new updates. Schedule regular content reviews and updates to maintain relevance and accuracy. This could include updating statistics, refreshing articles with new insights, or adding new multimedia elements.
- Engaging with Timely Topics: Stay informed about current trends and events related to your industry or niche. Creating content that addresses timely topics or emerging trends can capture users’ attention and encourage longer engagement. For instance, publishing articles or videos on trending subjects can attract more views and keep users engaged with your latest insights.
Tools and Resources for Tracking and Analyzing Engagement
Tracking and analyzing engagement is crucial for understanding user behavior and optimizing content. Various tools and resources are available to help you measure engagement metrics effectively. Here’s an overview of some key tools you can use to track and analyze engagement:
Google Analytics
- Overview: Google Analytics is one of the most widely used web analytics tools that provides a comprehensive suite of features for tracking user behavior and engagement on your website. It offers detailed insights into how users interact with your content, including metrics such as session duration, page views, and user flow.
- Key Features:
- Behavior Reports: Analyze metrics such as “Average Session Duration” and “Pages per Session” to understand how long users stay on your site and how they navigate through it.
- Engagement Metrics: Track user interactions, such as clicks, scroll depth, and time spent on specific pages.
- Custom Reports: Create customized reports to focus on specific engagement metrics relevant to your business objectives.
- How to Use: Set up Google Analytics on your website by adding the tracking code to your site’s code. Access the “Behavior” section to view reports related to user engagement. Use filters and segments to analyze specific user groups and interactions.
Hotjar
- Overview: Hotjar is a tool that provides visual insights into user behavior through heatmaps, session recordings, and feedback polls. It helps you understand how users interact with your website and identify areas for improvement.
- Key Features:
- Heatmaps: Visualize where users click, scroll, and move their mouse on your pages. Heatmaps can reveal which parts of your site attract the most attention and where users lose interest.
- Session Recordings: Watch recordings of individual user sessions to see how users navigate your site and interact with your content. This helps identify usability issues and areas for enhancement.
- Feedback Polls: Collect user feedback directly on your site to gain insights into their experiences and preferences.
- How to Use: Install the Hotjar tracking code on your website. Use the heatmaps and session recordings to analyze user behavior and identify patterns. Implement feedback polls to gather direct input from users about their experiences.
Launch your profitable online business today. Click below!
Try Wealthy Affiliate (For Free).
Mixpanel
- Overview: Mixpanel is an advanced analytics platform focused on tracking user interactions and analyzing user journeys across web and mobile applications. It provides detailed insights into user behavior and engagement, enabling you to make data-driven decisions.
- Key Features:
- Event Tracking: Track specific user actions, such as clicks, form submissions, and purchases. This helps you understand how users engage with different elements of your site or app.
- Funnel Analysis: Analyze user flows and conversion rates by creating funnels to see how users move through different stages of your site or app.
- Cohort Analysis: Segment users into cohorts based on behavior or attributes and analyze how engagement varies across different groups.
- How to Use: Integrate Mixpanel with your website or app to track user events and interactions. Use the dashboard to create custom reports and visualizations based on your engagement metrics. Leverage cohort analysis to identify trends and patterns in user behavior.
Other Specialized Engagement Tracking Tools
- Crazy Egg: Provides heatmaps, scroll maps, and A/B testing features to analyze user interactions and optimize website performance.
- Kissmetrics: Focuses on tracking individual user behavior and providing insights into customer journeys, conversions, and retention.
- Heap Analytics: Automatically captures user interactions and allows for retroactive analysis, making it easy to track and analyze engagement without manual event tagging.
How to Use:
- Choose the Right Tool: Select tools based on your specific needs and objectives. For example, use Google Analytics for comprehensive web metrics, Hotjar for visual behavior insights, and Mixpanel for detailed event tracking.
- Integrate with Your Platforms: Ensure that the tools are properly integrated with your website or app to capture accurate data. Follow setup instructions for adding tracking codes and configuring events.
- Analyze and Act: Regularly review the data and reports provided by these tools to identify trends, user behaviors, and areas for improvement. Use the insights gained to make data-driven decisions and optimize your content and user experience.
Conclusion
In summary, understanding and improving average engagement time per active user is crucial for enhancing the effectiveness of your digital presence and maximizing user interaction. Here’s a recap of the key points covered in this article, along with some final thoughts on the importance of continuous monitoring and improvement:
Recap of Key Points
- Definition and Importance: Average engagement time per active user measures the average amount of time users spend actively engaging with your content. It’s a valuable metric for understanding user behavior and content effectiveness. Unlike other metrics such as session duration, average engagement time provides insight into how deeply users interact with your material.
- Factors Influencing Engagement Time: Several factors can impact average engagement time, including content quality and relevance, user interface and user experience (UI/UX), frequency of content updates, and the devices or platforms used. Addressing these factors can help create a more engaging and enjoyable experience for users.
- Strategies to Improve Engagement Time: Effective strategies to boost average engagement time include enhancing content quality, optimizing UI/UX, personalizing user experiences, and regularly updating content. By focusing on these areas, you can encourage users to spend more time interacting with your content and improve overall engagement.
- Tools and Resources: A range of tools and resources are available to track and analyze engagement metrics, including Google Analytics, Hotjar, Mixpanel, and other specialized engagement tracking tools. These tools provide valuable insights into user behavior and help you make data-driven decisions to enhance engagement.
Importance of Continuous Monitoring and Improvement
Continuous monitoring and improvement are essential for maintaining and enhancing average engagement time. User preferences and behaviors can evolve, and digital landscapes can change rapidly. Regularly analyzing engagement metrics and staying updated with trends allows you to adapt your strategies and content to meet the needs of your audience effectively.
- Monitor Regularly: Use analytics tools to track engagement metrics consistently. Regular monitoring helps you identify trends, detect issues early, and understand how changes to your content or design impact user interactions.
- Analyze and Adjust: Analyze the data to gain insights into what’s working and what’s not. Make informed adjustments based on your findings to continuously improve the user experience and engagement. Experiment with different approaches and measure their impact to find the most effective strategies.
- Stay Informed: Keep up with industry trends and user behavior changes to ensure your strategies remain relevant. Incorporate new technologies and best practices to stay ahead of the competition and keep your content engaging.
Encouragement to Implement Strategies for Enhancing Engagement Time
Implementing the strategies outlined in this article can lead to significant improvements in average engagement time and overall user satisfaction. By focusing on high-quality content, optimizing user experience, personalizing interactions, and regularly updating your material, you can create a more engaging and rewarding experience for your audience.
Remember, enhancing engagement is an ongoing process. Continuously refine your approach based on feedback and data, and strive to provide content and experiences that resonate with your users. Embrace the opportunities to innovate and adapt, and you’ll likely see positive results in user engagement and satisfaction.
Ready for a life-changing opportunity? Click to begin
Try Wealthy Affiliate (For Free).
By taking proactive steps to improve average engagement time, you not only enhance user interactions but also contribute to the overall success of your digital strategies. Start implementing these strategies today and observe how they transform user engagement on your platforms.
We’d love to hear from you! How have you tackled improving average engagement time on your platforms? Do you have any strategies or tools that have worked well for you? Share your experiences, insights, or questions in the comments below. Your feedback and stories could help others facing similar challenges. Let’s continue the conversation and learn from each other’s experiences!